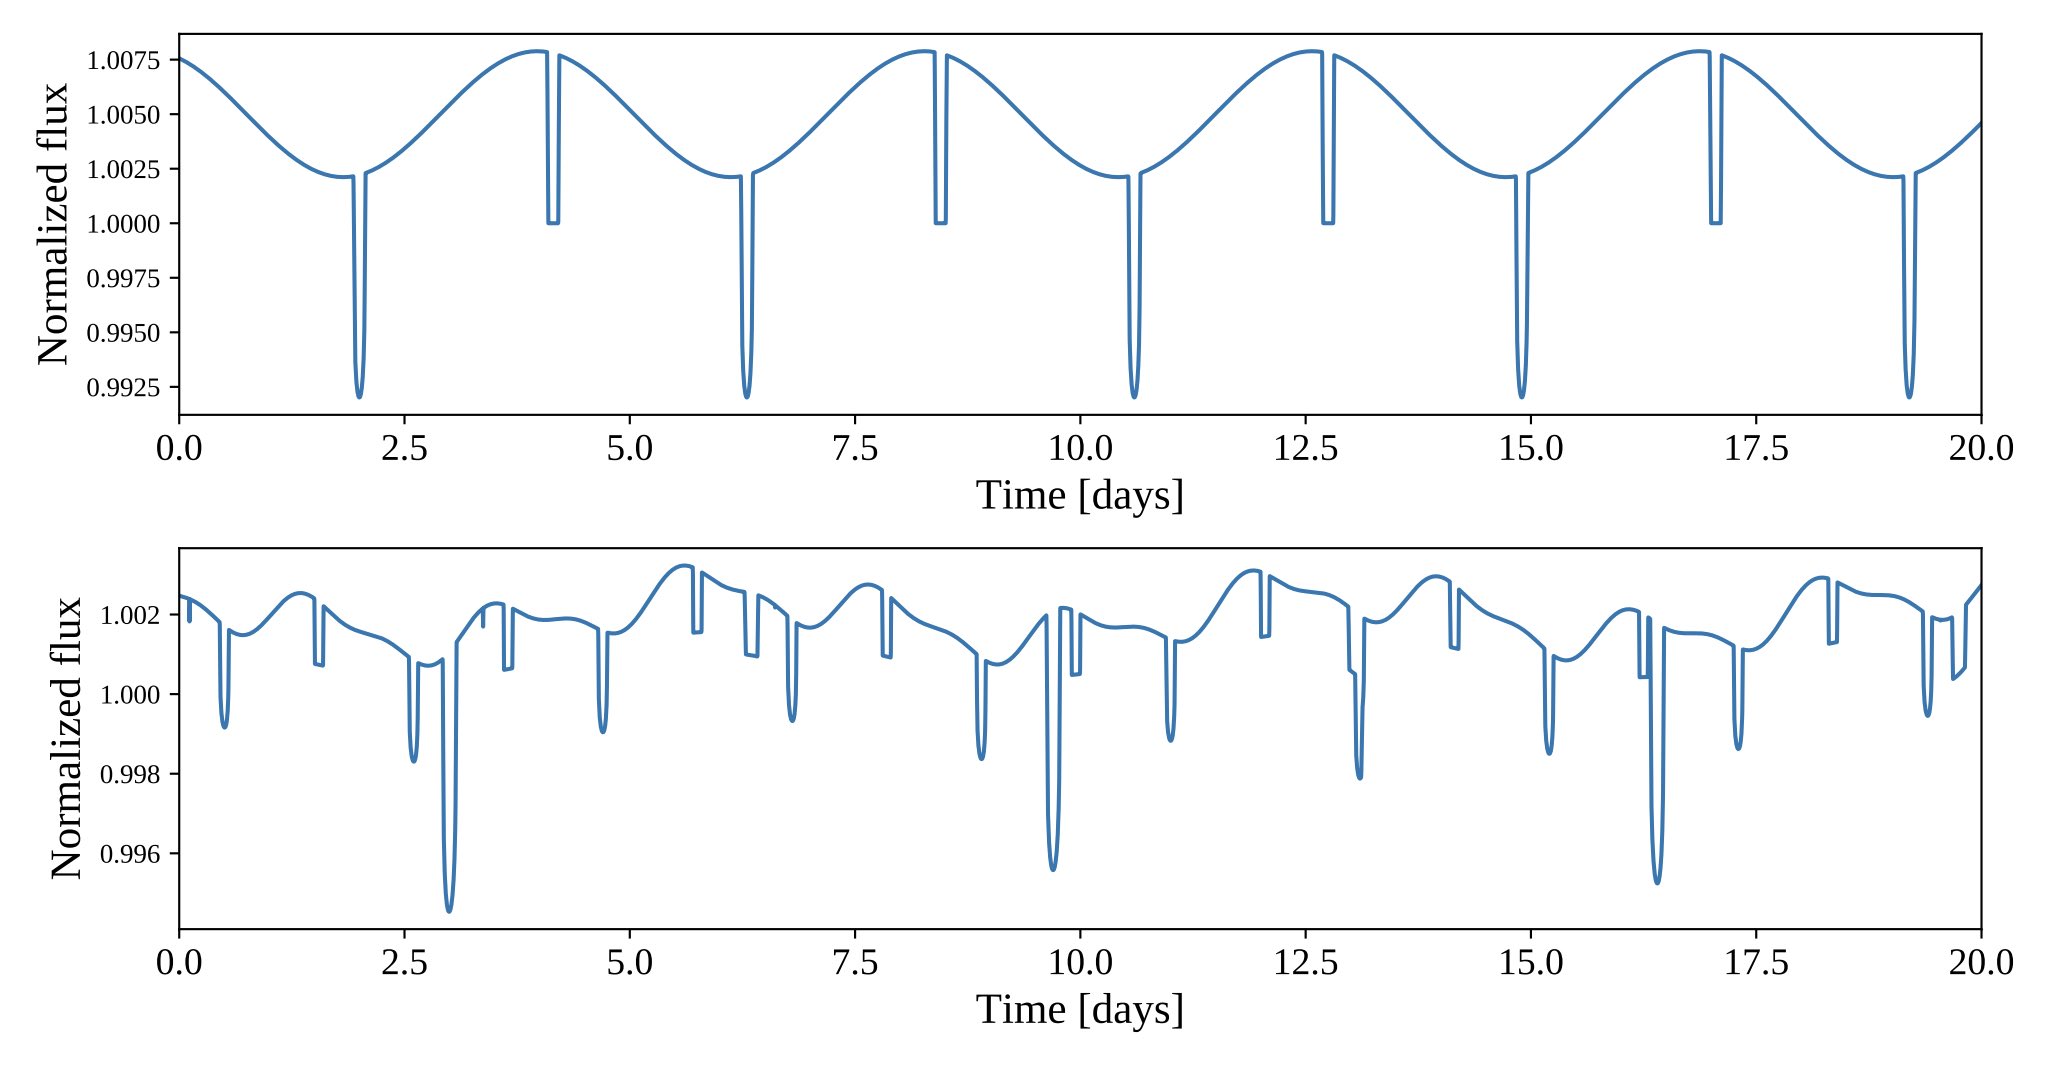
The starry code package is a suite of tools for mapping stars and exoplanets based on timeseries data. It enables the computation of transit and secondary eclipse light curves of exoplanets, light curves of eclipsing binaries, rotational light curves of stars, rotational phase curves of exoplanets, light curves of planet-planet and planet-moon occultations, light curves in reflected light, and more. By modeling celestial body surface maps as sums of spherical harmonics, starry does all this analytically and is therefore fast, stable, and differentiable. starry is coded in C++ and wrapped in Python.
Recently, I used starry to map the surface of the Earth from the scattered light in the background pixels of the TESS satellite. The starry algorithm is also at the heart of the exoplanet package for analysis of exoplanet transit light curves and the limb darkening code for fast modeling of transits across stars with arbitrary order polynomial limb darkening. I am currently working on a paper extending the starry formalism to reflected light curves of exoplanets and solar system moons, as well as on a paper to enable fast, semi-analytic models of Doppler imaging datasets for stars. Finally, I am working on turning the starry algorithm into an interpretable Gaussian process, whose hyperparameters are physical properties of the star, such as the size, contrast, and latitude(s) of star spots. Stay tuned!