everest - Command line access
The everest command accepts several options, which we list below.
ID |
The target ID number (required) |
-1 |
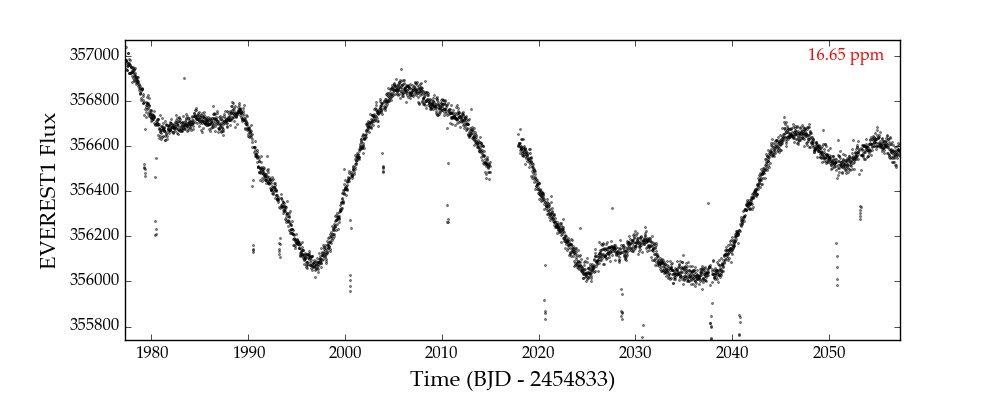
Plot the everest 1.0 de-trended light curve (K2 only) |
-2 |
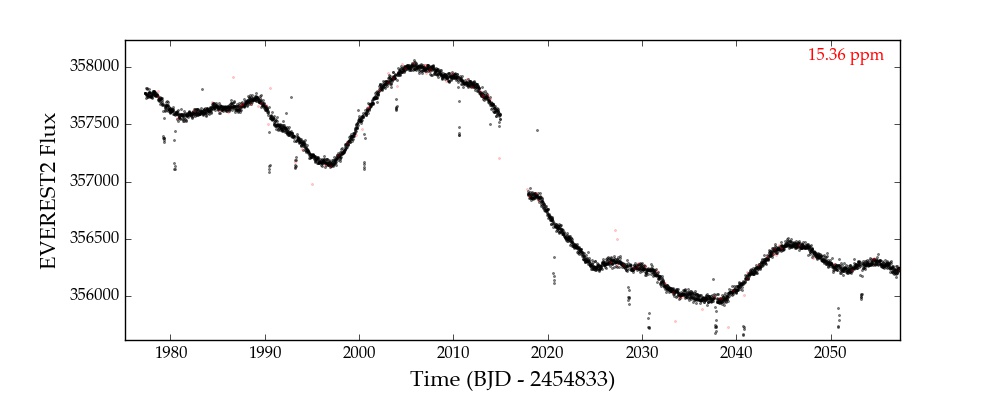
Plot the everest 2.0 de-trended light curve (default) |
-a |
Plot the target aperture/postage stamp |
-c cadence |
Cadence type (lc | sc). Default lc |
-d |
Show the everest 2.0 data validation summary |
-f |
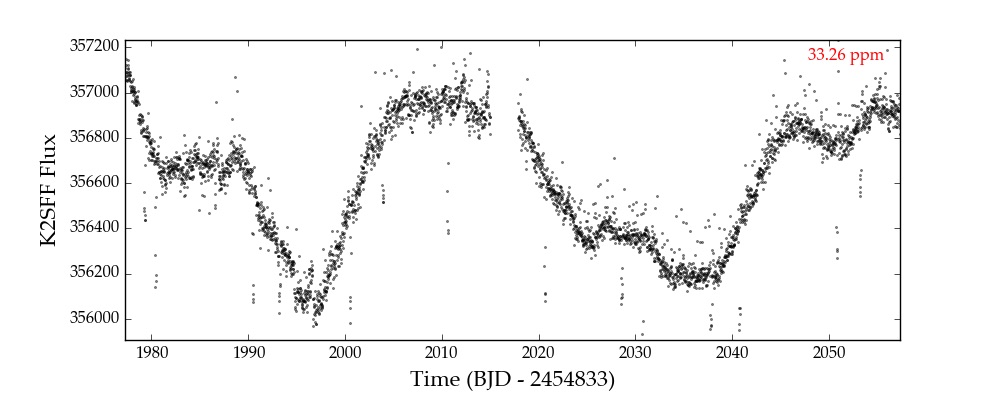
Plot the k2sff light curve for the target (K2 only) |
-h |
Show the help message and exit |
-m mission |
The mission name (k2 | kepler | tess). Default k2 |
-n |
Do not apply the CBV correction |
-r |
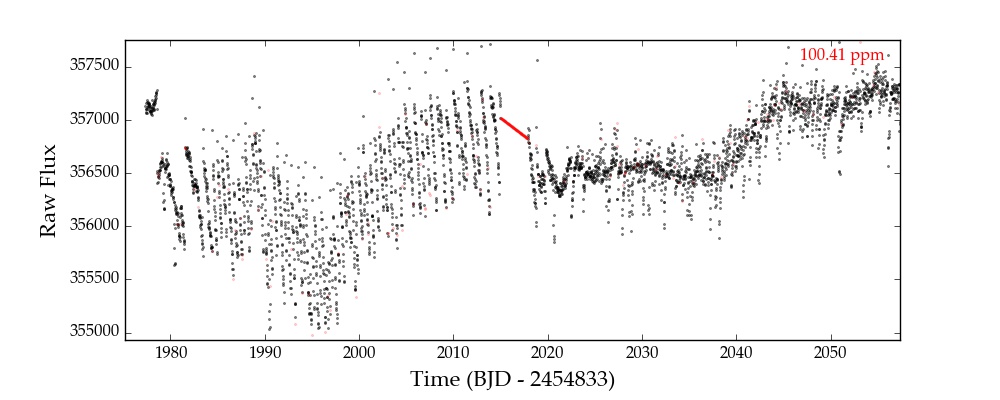
Plot the raw light curve |
-s |
Plot the k2sc light curve for the target (K2 only) |
This tool implements most of the basic everest functionality. It automatically
downloads light curves and data validation summaries from MAST and plots them with some
customization. Below we show some examples. For other options and further customization,
see the Python user interface section.
Everest 2
The -2 option (default, if no flags are present) shows the light curve de-trended
with the current version (2) of the pipeline:
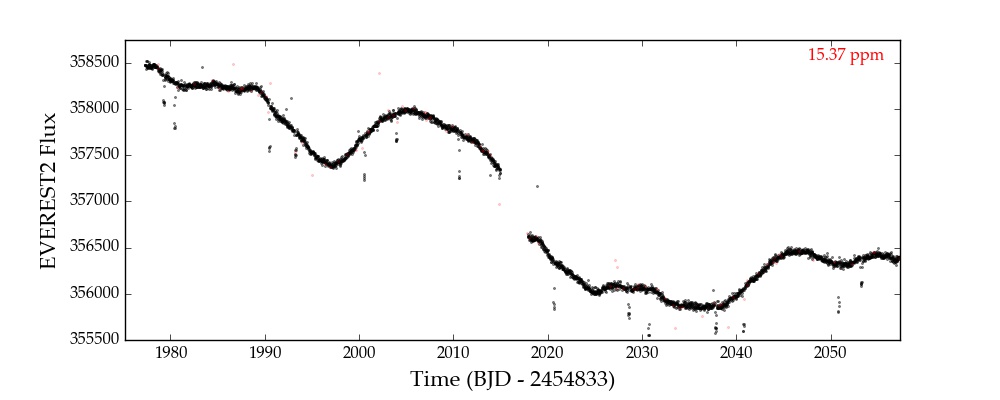
If the -n flag is present, the code does not apply the CBV correction, resulting
in a light curve with a bit more low-frequency residual systematics:
Other pipelines
Other supported pipelines can be plotted with the --pipeline_name flag,
or with the abbreviated flags (i.e., -f for k2sff or
-s for k2sc). Here’s the plot for everest 201367065 –k2sff:
Data Validation Summary
Aperture
Nothing too fancy. The -a flag plots the postage stamp with the aperture
used to de-trend:

The plots show snapshots of the postage stamp at the beginning of the timeseries (start),
the middle of the timeseries (mid) and the end of the timeseries (end). The
final plot (hires) is a high resolution image of the target. For K2, this
is taken from the Palomary Observatory Sky Survey.