
Reproducible scientific articles
In this post I'll talk a bit about showyourwork!, the open source scientific article workflow I've been working on for the past few months. It's still very much a work in progress, but you can already use it in your own research to ensure the reproducibility of your results! If you're interested, please check out the GitHub repository and the documentation.
Figure 1
Articles that use showyourwork! are automatically built on GitHub Actions CI to ensure the constant reproducibility of the results.
showyourwork! is a workflow that enables the creation and distribution of fully reproducible and open source scientific articles. As astronomical software becomes increasingly more complex, and as research results become increasingly more interdependent, it is crucial to ensure the validity and correctness of papers published in the field. However, the current peer review system is simply not set up to do this, since checking all of the results in a paper would require the painstaking and methodical review of all of the paper’s methods—which usually means scrutinizing all of the code used to generate the figures, tables, and other quantities in the paper. In practice, this is virtually impossible for three reasons:
1. Modern codebases can be very large and often require deep familiarity with the software to use—not to mention review them.
2. Writing a paper in astronomy is rarely ever done in a linear, procedural fashion: the codebase is constantly changing, and the state of the code when (say) Figure 1 was produced may be very different from that when (say) Figure 2 was made. Moreover, many results depend on the execution of lengthy pipelines with intermediate steps, each potentially requiring manual tinkering that is not always documented and may be difficult to exactly replicate.
3. The majority of astronomical code is not open source and simply cannot be vetted by third parties. While there has been a marked increase in the number of open source astronomical tools in recent years (e.g., astropy, exoplanet, emcee, exofast...), most code associated with the generation of the results in individual papers is not open source; readers are often expected to take it on faith that there are no bugs in that code, or that the code works exactly as described in the text, with no pitfalls or missing details. Even when the code is made publicly available, e.g., by being published on GitHub, it is often not documented sufficiently to enable one to execute it and reproduce the paper’s results out-of-the-box. And even with proper documentation, the code may require external dependencies, custom virtual environments, or access to closed-source datasets that make it difficult or impossible for a third party to replicate it.
showyourwork! was designed to tackle these three issues, making it easy to develop, publish, and distribute truly open and reproducible research papers in astronomy. It exists as a GitHub template repository, which can be cloned at the click of a button to set up a new article. Users then add their LaTeX manuscript, bibliography, scripts used in the generation of the paper’s figures, an anaconda environment specification, and instructions on how to download any external datasets required by the figures. Every time the user pushes a new commit to GitHub, the article is automatically built on the cloud using GitHub Actions and the resulting PDF is pushed to a separate branch of the repository. The build step—which sets up the conda environment, generates all figures from scratch (with intelligent caching), and compiles the PDF—acts as a unit test for the paper. If it passes, the paper is (by definition) reproducible.
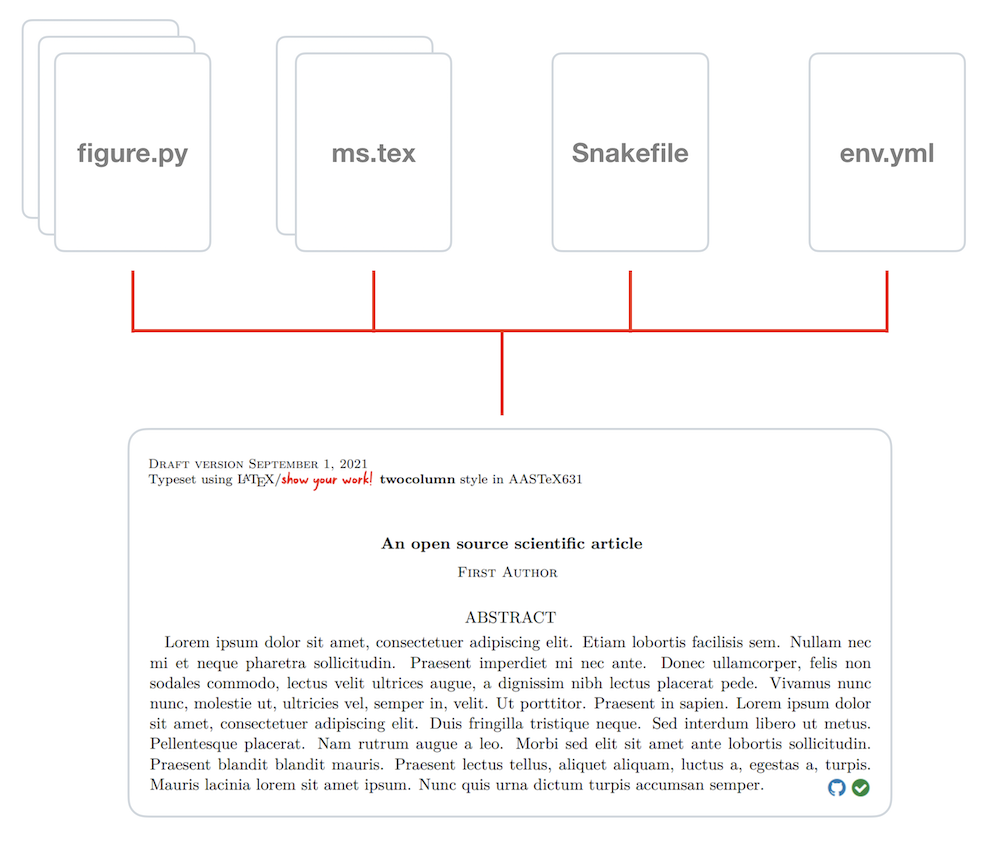
Figure 2
The showyourwork! philosophy: scientific papers should exist as GitHub repositories comprised of LaTeX files, figure scripts, rules to access datasets, a platform/environment specification, and nothing else. Anyone should be able to re-generate the article PDF from scratch at the click of a button.
The workflow works out of the box for simple projects, in which each figure is generated by running a given Python script. But it also works for more complicated pipelines, such as projects that depend on many intermediate steps or those that require running expensive simulations on clusters. showyourwork! interfaces directly with Zenodo, allowing users to automatically upload the results of simulations so that expensive build steps can be bypassed on the cloud. In fact, most of the stuff under the hood in showyourwork! is there to make the workflow as flexible and customizable as possible; see the documentation for a list of examples of custom workflows.
Papers that use showyourwork! can be reproduced by cloning the repository and running make. Furthermore, these papers include clickable icons next to each of their figures linking to (1) the exact version of the script used to generate them and (2) the exact version(s) of the Zenodo-hosted dataset(s) used in their creation.
If you are interested in showyourwork!, please visit the GitHub repository as well as the documentation. Specifically, check out
showyourwork! is a work-in-progress. I am still actively developing it and working with several users, in astronomy and in other fields to make it flexible enough to accommodate various kinds of workflows. I released showyourwork! in mid-October 2021 and there are already four papers on the arXiv that were generated using it, with several others in prep. If you would like to contribute to the development or have any suggestions or feedback about showyourwork!, please contact me, post a comment in the discussion below, raise an issue, or open a pull request!
Rodrigo Luger
I'm a Flatiron Fellow at the CCA in New York City, working on a variety of things related to exoplanets, stars, and astronomical data analysis. I'm interested in systematics de-trending, the search for and characterization of potentially habitable exoplanets, and the mapping of stellar and exoplanetary surfaces from photometric and spectroscopic datasets. Outside the office I love to hike, bike, swim, craft lattes, faulty parallelism, and Oxford commas.