So I started a blog...
Ever since I started my postdoc at the CCA, it feels like I've started a million different projects (and finished none). I have a lot of half-finished (or more like half-baked) ideas that I felt I had to write down somewhere, so I decided to start a blog! This blog will be a mishmash of posts on astronomy, data science, math, and any other random thoughts that pop into my head.
My main scientific interest right now is the mapping problem: trying to figure out what a (celestial) object looks like based only on its unresolved light curve (i.e., the changing flux we observe over time as the object spins on its axis). Astronomers have been studying the light curves of stars and solar system objects for over a century, trying to figure out the shapes and albedo distributions of asteroids and the spot properties of magnetically active stars. More recently, this same technique has been applied to exoplanets: we can study their changing phase curves as they orbit their host star to infer temperature differences across their surfaces, which can tell us a whole host of information about their surface morphology, their atmospheres, and even (some day) their habitability. In the age of big data, where thanks to missions like Kepler and TESS we now have access to hundreds of thousands of stellar light curves, one might expect that astronomers have already figured out everything there is to know about stellar and planetary surfaces from their light curves. But, unfortunately, that is far from being true. The reason is mathematical in nature: the mapping problem is extremely ill-conditioned.
Figure 1 To which of these planets does the phase curve at right correspond? This figure was generated from this python script.
I like showing the figure above whenever I give talks, as it summarizes why the mapping problem is so difficult to tackle. Consider the following thought experiment:
Imagine that in the not-so-distant future we launch a large, coronagraph-equipped imaging telescope to measure the phase curve of a planet in the habitable zone around a nearby star. We measure the light curve shown at right in the figure, in which the stellar contribution has been removed. Armed with their own sophisticated imaging algorithms, four different teams of astronomers promptly submit papers to a prestigious scientific journal claiming to have produced the first map of a terrestrial planet in the habitable zone, showing evidence of clouds, oceans, and continents. The four maps are shown at the left of the figure. However, as you can see, they all look very different from one another. As the editor of this scientific journal, you must decide which (if any) of these maps is correct. Which team should have their paper accepted and win eternal scientific glory (and quite possibly a Nobel prize)?
The answer, you may have guessed, is (probably) none of them. Not because they did anything wrong in their analysis; in fact, all four of the maps shown are perfectly consistent with the observed light curve. And that is exactly the problem: the light curve admits an infinite number of map solutions, even at infinite signal-to-noise. The problem is so degenerate that surface maps that look nothing alike give equally good fits to the data. Absent other data or good priors, there is no way to infer a unique surface map from a planetary or stellar phase curve.
Fortunately, however, this does not spell doom for the mapping problem. Thinking as a Bayesian, if our data is not sufficiently informative, we either need to get a better dataset or find a better prior. While phase curves aren't that informative about the surface map that generated them, occultation light curves are. If observed at high enough signal-to-noise and cadence, secondary eclipses of exoplanets can be extremely informative about their surface brightness (or temperature) distributions. This is the case with HD 189733b, a hot Jupiter whose secondary eclipsed was analyzed to infer a very low-resolution map of its surface (Figure 2).
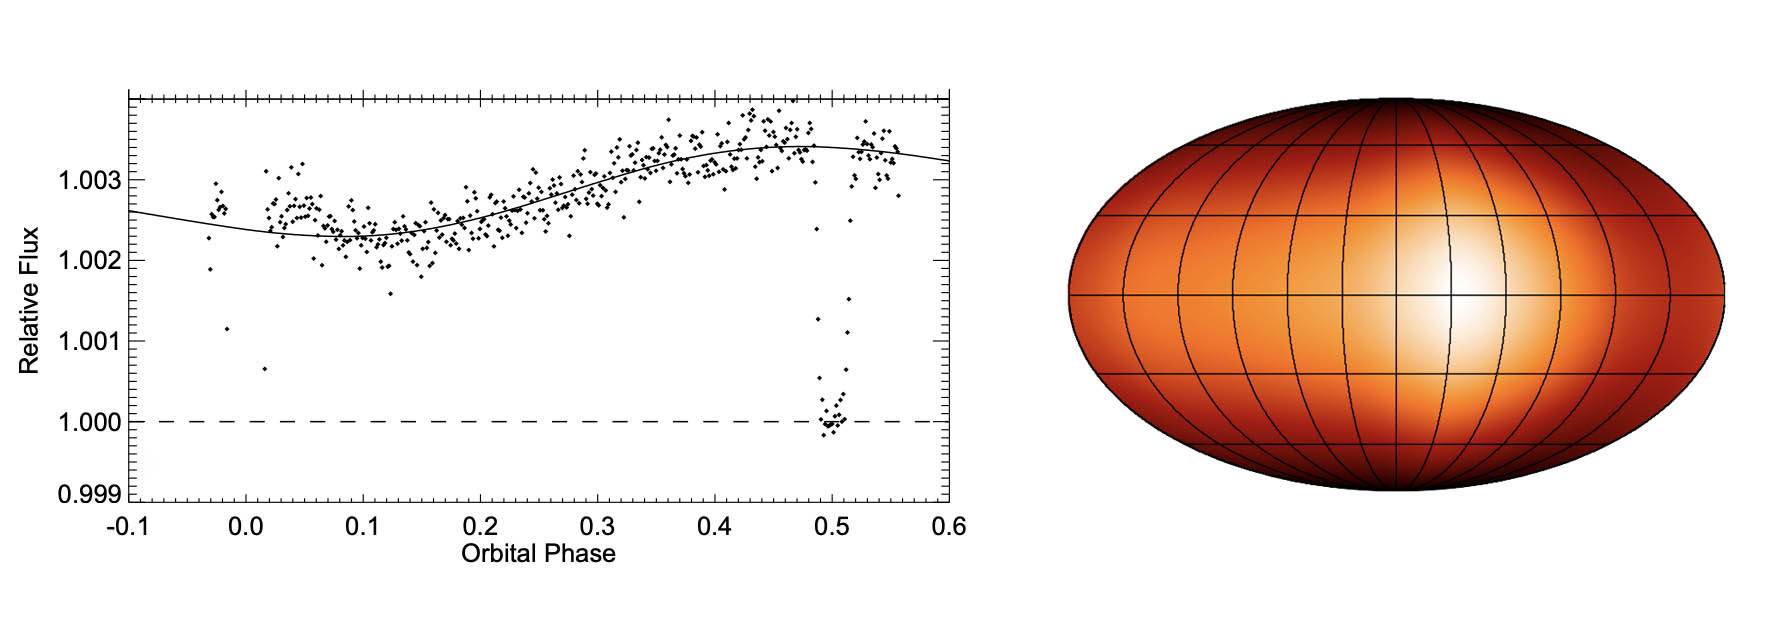
Figure 2 A light curve of HD 189733 (left) and the inferred surface map of its hot Jupiter companion, HD 189733b (right), from Knutson et al. (2007) and Majeau et al. (2012).
Similarly, transits of planets across stars can yield exquisite constraints on their star spot sizes and latitudes. Even more promising are observations that take advantage of the wavelength dimension, such as Doppler imaging. Commonly applied to giant stars, this technique takes advantage of the changing Doppler shift of star spots as they rotate into and out of view, imparting subtle line shape changes to the stellar spectrum. These line shape changes encode an incredible amount of information — much more than a phase curve.
I plan on writing about all these different techniques in future posts (I have lots of thoughts about them!), but in the next couple posts I want to focus on the other way we can improve our inference: with better priors. It's true that phase curves are only weakly informative about surface maps, but nowadays we just have so incredibly many of them (hundreds of thousands of stellar light curves, thanks to Kepler and TESS) that it would be a huge shame if they proved useless for the mapping problem.
Fortunately, that is not the case!
With clever statistical tricks, lots of data, and some fancy math, it is possible to squeeze more information out of these light curves to infer the things we actually care about: star spot properties, exoplanet atmosphere properties, and (eventually) surface properties of temperate terrestrial exoplanets. I plan to write a lot more about how to do this in future posts, so if you're interested, stay tuned!
Rodrigo Luger
I'm a Flatiron Fellow at the CCA in New York City, working on a variety of things related to exoplanets, stars, and astronomical data analysis. I'm interested in systematics de-trending, the search for and characterization of potentially habitable exoplanets, and the mapping of stellar and exoplanetary surfaces from photometric and spectroscopic datasets. Outside the office I love to hike, bike, swim, craft lattes, faulty parallelism, and Oxford commas.