doppler imaging

The study of stellar surfaces can reveal information about the chemical composition, interior structure, and magnetic properties of stars. It is also critical to the detection and characterization of extrasolar planets, in particular those targeted in extreme precision radial velocity (EPRV) searches, which must contend with stellar variability that is often orders of magnitude stronger than the planetary signal. One of the most successful methods to map the surfaces of stars is Doppler imaging, in which the presence of inhomogeneities is inferred from subtle line shape changes in high resolution stellar spectra.

In my latest paper, Mapping Stellar Surfaces III: An Efficient, Scalable, and Open-Source Doppler Imaging Model, I presented a novel, efficient, and closed-form solution to the problem of Doppler imaging of stellar surfaces. My model explicitly allows for incomplete knowledge of the local (rest frame) stellar spectrum, allowing one to learn differences from spectral templates while simultaneously mapping the stellar surface. It therefore works on blended lines, regions of the spectrum where line formation mechanisms are not well understood, or stars whose spots have intrinsically different spectra from the rest of the photosphere.

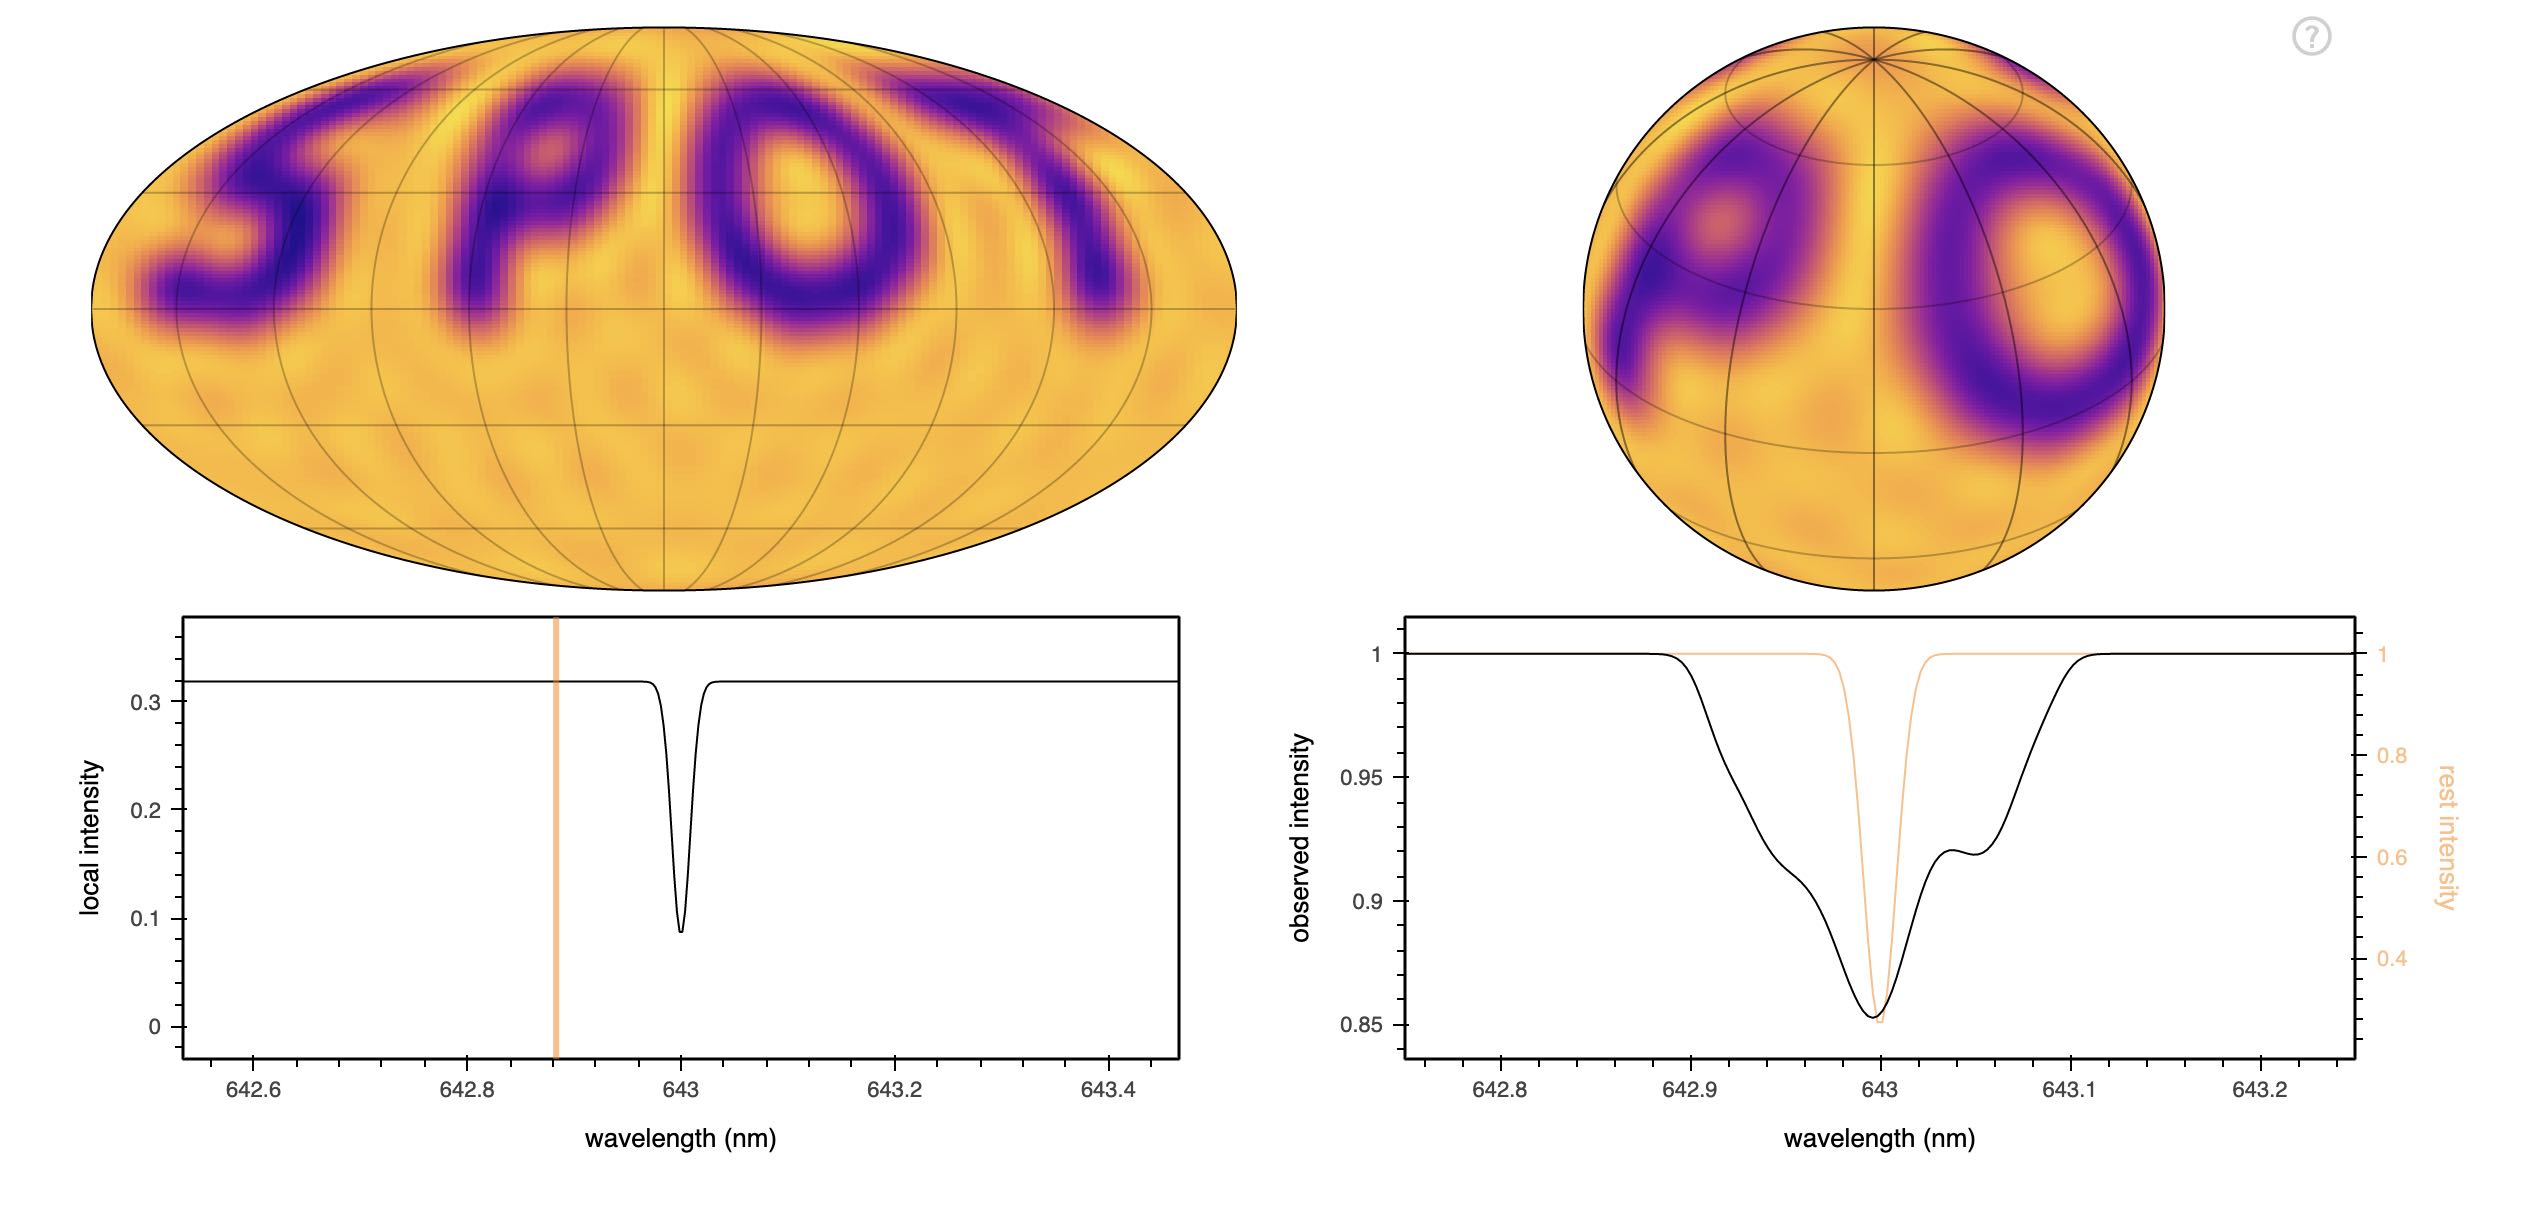
I implemented this Doppler imaging model within my open source starry stellar modeling framework, making it fast, differentiable, and easy to use in both optimization and posterior inference settings.

As a proof-of-concept, I used starry to infer the surface map of the brown dwarf WISE 1049-5319B, finding close agreement with the solution of Crossfield et al. (2014). In the paper, I also discuss Doppler imaging in the context of EPRV studies and describe an interpretable spectral-temporal Gaussian process for stellar spectral variability that will be important for EPRV exoplanet searches.


Figure 1 A sample Doppler imaging problem visualized using the starry package. Click on the figure to load the interactive visualization. Then, interact with it by moving the mouse over the map at the top left to show the emergent, rest frame spectrum at different points on the surface in the plot at the bottom left. Scroll (with the mouse wheel or track pad) to change the wavelength at which the map is visualized (top left) or to rotate the orthographic projection of the map (top right). The plot at the bottom right shows the observed spectrum at the current phase (black) and the corresponding rest frame spectrum absent Doppler shifts (orange).