scatter.py 
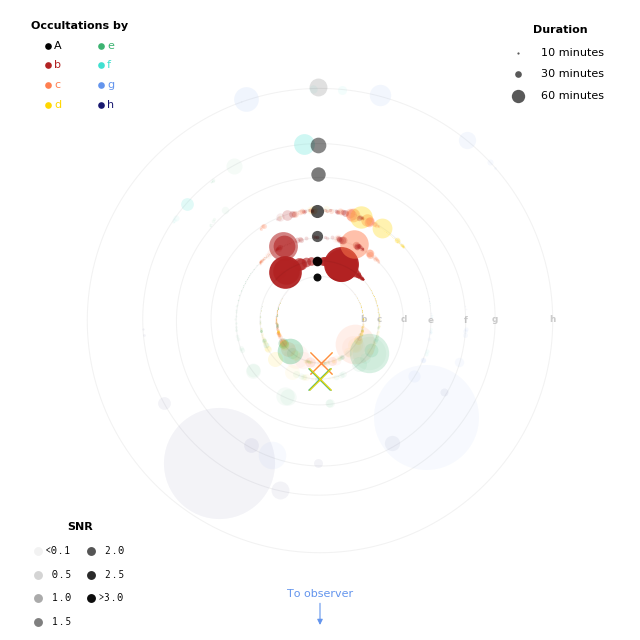
Computes all occultations that occur in the TRAPPIST-1 system over a 3 year time period for a random draw from the prior. Plots each occultation as a circle in a top-view of the system; the circle size, transparency, and color indicate the duration, SNR, and occulting body, respectively.
-
scripts.scatter.Run(eyeball=True, save=True)¶ Computes and plots the scatter plot for the TRAPPIST-1 system seen with JWST MIRI at 15 microns over the course of 3 years.
Parameters: eyeball (bool) – Assume the radiative equilibrium surface map? Default True. IfFalse, uses the limb-darkened surface map.
-
scripts.scatter.scatter_plot(system, tstart, tend, dt=0.001, sz=0.2)¶ Compute all occultations between tstart and tend and plot an occultation scatter plot like the one in the paper.
Parameters: - tstart (float) – The integration start time (BJD − 2,450,000)
- tend (float) – The integration end time (BJD − 2,450,000)
- dt (float) – The time resolution in days. Occultations shorter than this will not be registered.
- sz (float) – The size scaling for the occultation circles. Default 0.2